Koval's 3D Grapher
alankoval.com/3dgrapherBest on Chrome, at the moment
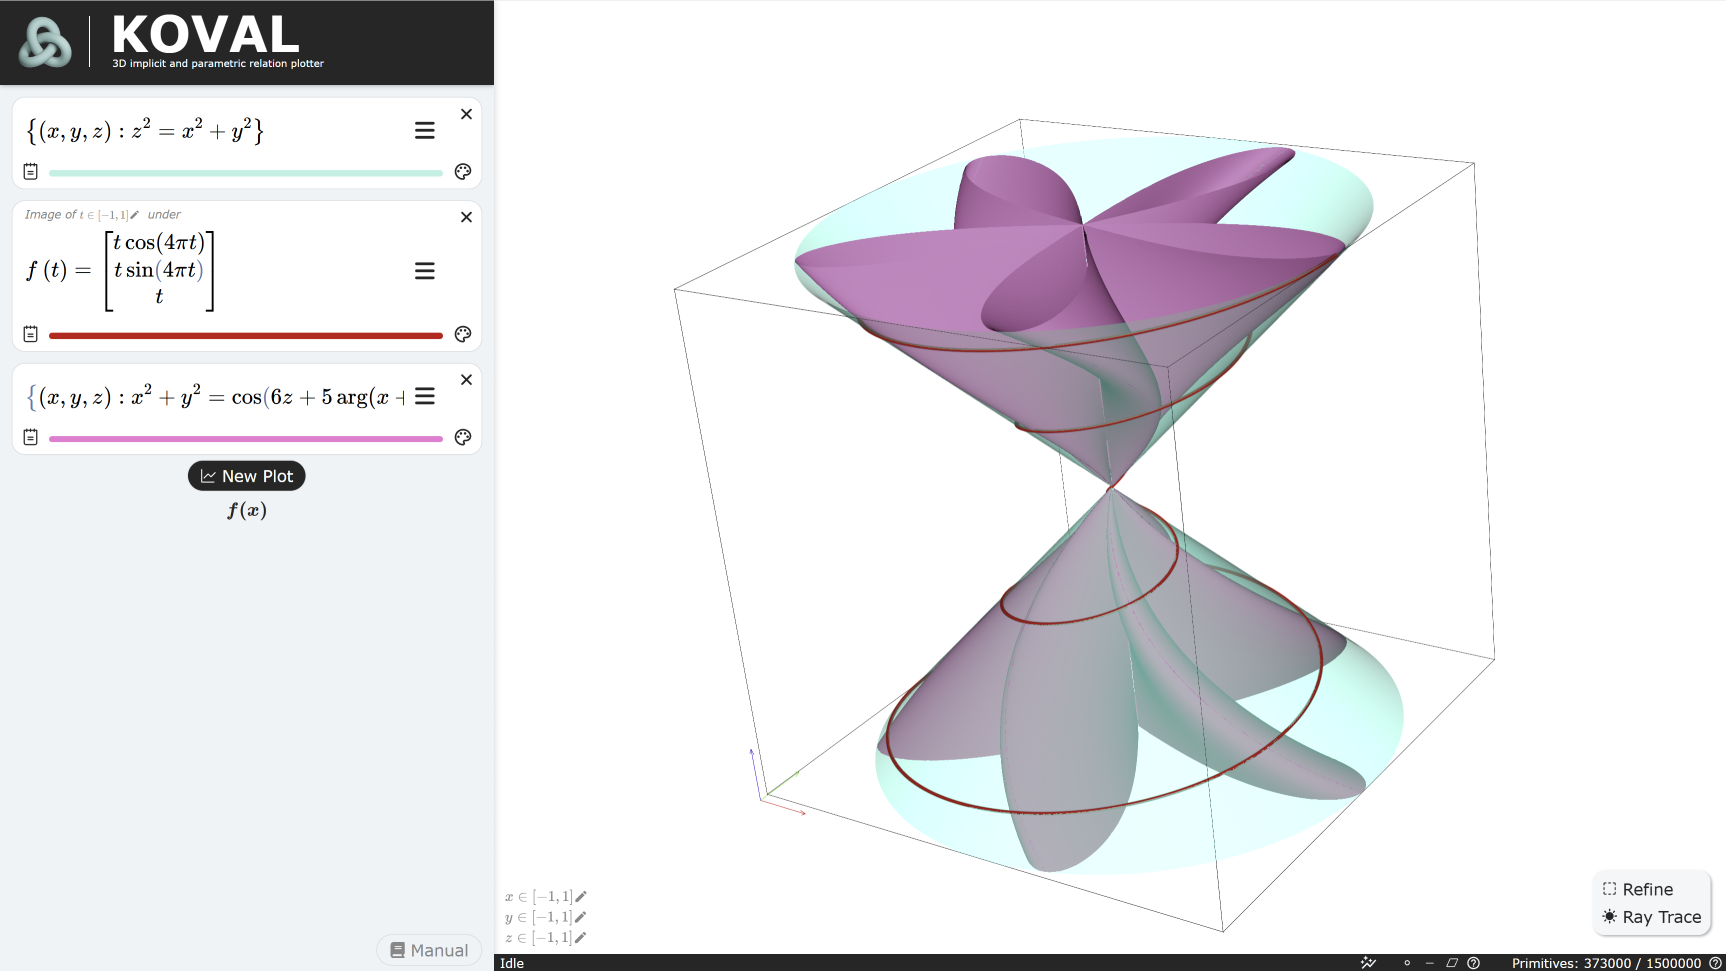
There are surprisingly many entries in the category of "online 3D function plotter". Most fill a particular niche, and after substantial development on Koval's 3D Grapher, It's hard for me to imagine any 3D grapher being the best in every category. Some plotters, such as the lovely Spirulae, are optimized for speed. As might be expected, Desmos 3D offers a more polished, educational experience. Koval's 3D Grapher emphasizes accuracy and flexibility over speed. How do they all compare?
Dimensional Capabilities
| Name | Implicit 0D | Implicit 1D | Implicit 2D | Implicit 3D | Parametric 1D | Parametric 2D | Parametric 3D |
|---|---|---|---|---|---|---|---|
| Koval's 3D Grapher | ✅ | ✅ | ✅ | ❌ | ✅ | ✅ | ❌ |
| Desmos 3D | ❌ | ❌ | ✅ | ✅ | ❌ | ❌ | ❌ |
| Geogebra 3D | ✅ | ✅ | ✅ | ❌ | Limited | ❌ | ❌ |
| Spirulae | ❌ | ❌ | ✅ | ❌ | ❌ | ✅ | ❌ |
| Math3d | ❌ | ❌ | Limited | ❌ | ✅ | ✅ | ❌ |
| CalcPlot3D | ❌ | ❌ | ✅ | Limited | ✅ | ✅ | ❌ |
| MathPix | ❌ | ❌ | Limited | ❌ | ✅ | ❌ | ❌ |
| Design Concept | ❌ | ❌ | ✅ | ❌ | ❌ | ❌ | ❌ |
| MathBox Demos | ❌ | ❌ | ❌ | ❌ | ✅ | ✅ | ❌ |
| Ice Fractal | ❌ | ❌ | ✅ | ❌ | ❌ | ❌ | ❌ |
Not every locus of a relation \(f(x,y,z)=0\) is a two-dimensional surface.
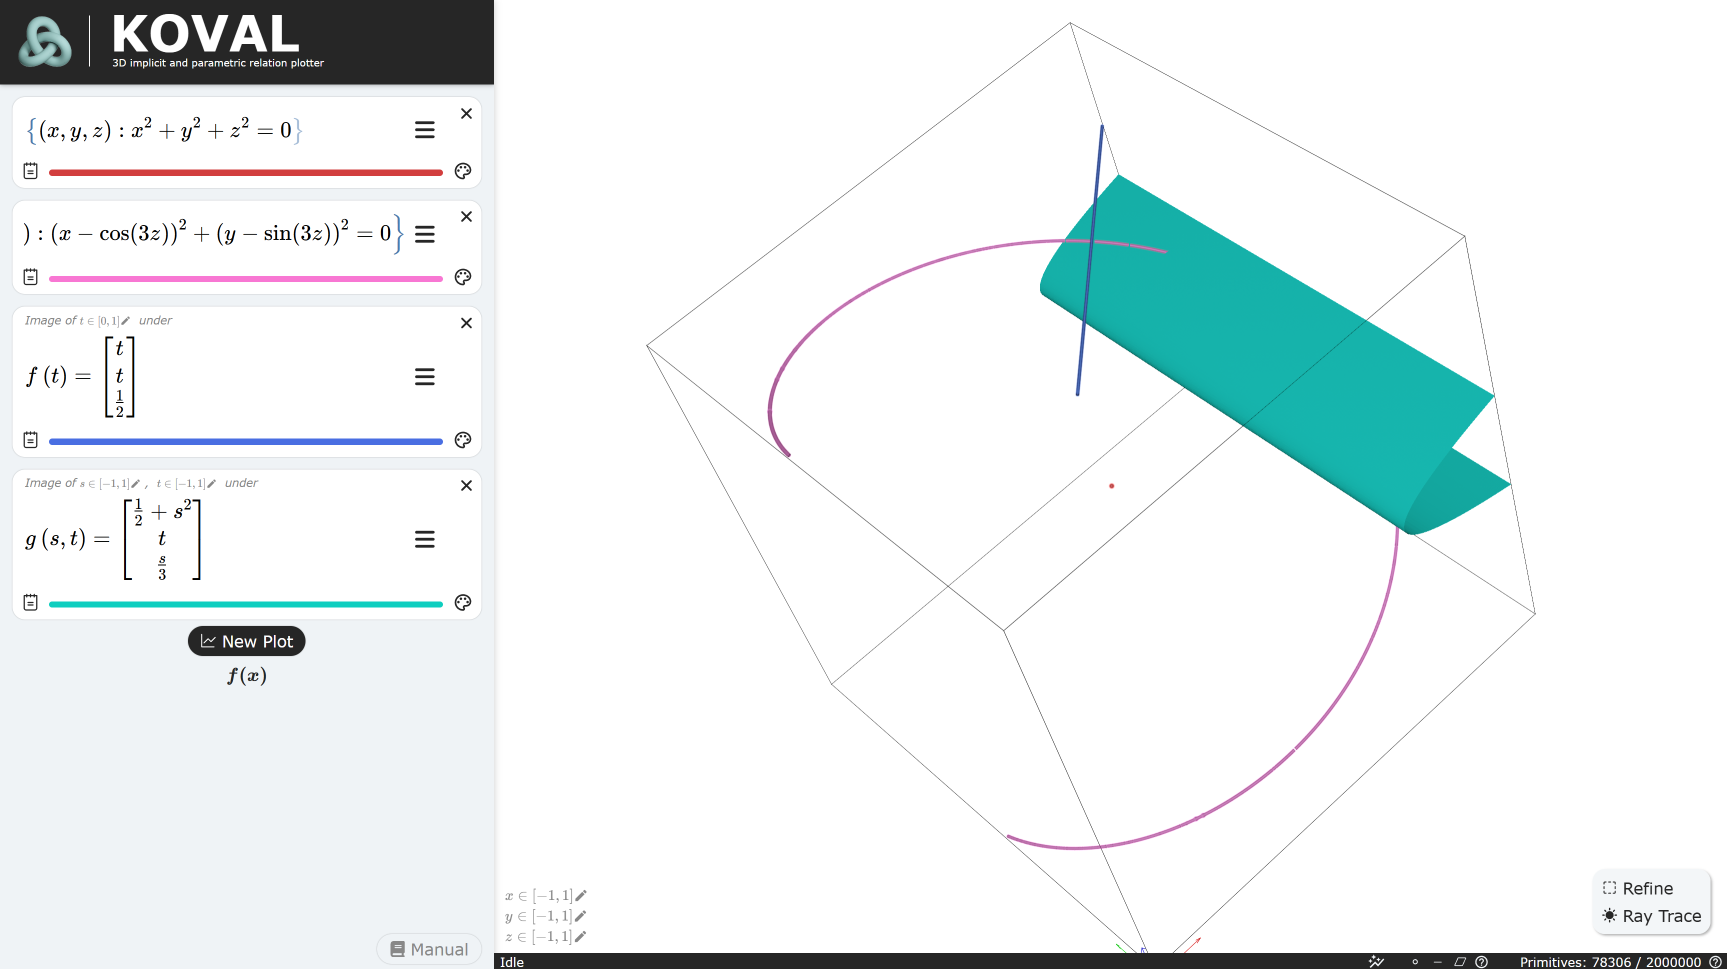
- If a plotter was able to indicate that \(x^2+y^2+z^2=0\) resulted in a single point, it passed the "Implicit 0D" check.
- If a plotter was able to indicate that \(x^2+y^2=0\) resulted in a line, it passed the "Implicit 1D" check.
- Almost all plotters were able to identify 2D surfaces appropriately, as this is the standard output of a relation between three variables. Some plotters received a "limited" score, if they only supported functions of two variables (e.g., \(z=f(x,y)\)).
- If a plotter was able to plot a parametric curve like \(f(t)=\begin{bmatrix}t\\t\\t \end{bmatrix}\), it passed the "Parametric 1D" check.
- If a plotter was able to plot a parametric surface like \(f(s,t)=\begin{bmatrix}s\\t\\ 0\end{bmatrix}\), it passed the "Parametric 2D" check.
- No plotter had capabilities for 3D parametric plotting, which would be the image of a unit cube under some function. This is understandable, since the 2D boundary of such a volume usually suffices.
Plot Input
| Name | LaTeX | LaTeX Preview | Helper Functions | Derivatives | Complex Numbers | Matrices | Animation | Zoom on Scroll |
|---|---|---|---|---|---|---|---|---|
| Koval's 3D Grapher | ✅ | N/A | ✅ | ✅ | ✅ | ✅ | ❌ | ❌ |
| Desmos 3D | ✅ | N/A | ✅ | ✅ | ✅ | ❌ | ✅ | ✅ |
| Geogebra 3D | ✅ | N/A | ✅ | ✅ | ❌ | ✅ | ✅ | ✅ |
| Spirulae | ❌ | ✅ | ✅ | ❌ | ❌ | ❌ | ✅ | ✅ |
| Math3d | ✅ | N/A | ✅ | ✅ | ❌ | ❌ | ✅ | ❌ |
| CalcPlot3D | ❌ | ✅ | ❌ | ❌ | ❌ | ❌ | ❌ | ❌ |
| MathPix | ✅ | N/A | ❌ | ❌ | ❌ | ❌ | ❌ | ❌ |
| Design Concept | ❌ | ❌ | ❌ | ❌ | ❌ | ❌ | ❌ | ❌ |
| MathBox Demos | ❌ | ❌ | ❌ | ❌ | ❌ | ❌ | ❌ | ❌ |
| Ice Fractal | ❌ | ❌ | ❌ | ❌ | ❌ | ❌ | ❌ | ❌ |
Here "Zoom on Scroll" indicates re-plotting at the new zoom level.
Koval's 3D Grapher, Desmos 3D, and Geogebra 3D use custom parsers to transform LaTeX (or equivalent) into a evaluable format. Spirulae has a custom parser for plain text. MathPix likely does their own parsing too, as they probably have one lying around from their other (corporate) projects. Math3D uses some heuristics to transform LaTeX into something parsable by MathJS.
Koval's 3D Grapher transforms LaTeX into an internal format that can be (1) symbolically differentiated, and (2) easily transformed into javascript for evaluation in web workers. This allows for low-hanging optimizations, like duplicate code removal and function inlining. Since Koval's 3D Grapher supports functions with arbitrary arguments (e.g., other functions), this turns out to be more of an exercise in compilers than one might expect. After experimenting with ANTLR4 for tokenizing and parsing, I settled on writing my own (operator precedence) parser for performance reasons.
Koval's 3D Grapher is not fast enough to support animation or re-plotting on zoom. At some point, I would like to pass off plotting to the GPU, but there are significant precision and implementation issues.
Implicit Plot Algorithm
| Name | Precision | Quality Settings | \(z^2=0\) | \(z=\lfloor x \rfloor\) | \(z=|x|+|y|\) | \(z=\sin(1/x)\) | \(x^2+y^2=z^4(1-z)\) | \((x^2+y^2)z=0\) |
|---|
Parametric Plot Algorithm
| Name | Screen-space \(uv\) |
|---|
Graphics and Rendering
| Name | Rasterized | Ray-Marched | Voxel | Directional Lighting | Transparency | Coloring | Axes Style | Gradients |
|---|